
Friday Headlines, September 8, 2017
THE LATEST IN THE GEOSCIENCES
Today’s round-up:
Irma on my mind…
Hurricane Irma is bearing down on the state of Florida. Today’s headlines are about how we know what we know about hurricanes well before they make landfall.
- Doppler Radar – How does it work?
- Satellite Precipitation Measurements – How is this possible?
- Forecast Tracks – How do they do that?
DOPPLER RADAR
We’re familiar with the radar maps that we see on the news weather forcasts. For example, here is the radar from Buffalo, NY during the evening of September 7.

Doppler radar works by having a a radar emitter (the Doppler tower) shooting radar beams into the surrounding skies. If water is present in the atmosphere (rain or snow), the radar is reflected back. The intensity of the reflected beam tells us about the amount of water present.
If there’s motion of that airborne water, say like a cyclone, the reflected beam will be of a different wavelength than the beam originally emitted. If the water vapor, rain, or snow are moving away from the radar emitter, the wavelenght increases. If the water vapor, rain, or snow is moving toward the radar emitter, the wavelength gets shorter. This is the Doppler effect, from which Doppler radar gets its name. With this we can detect rotation in storms and identify tornadoes before they touch down.

But Doppler radar has its limits. Though we knew hurricane Irma is moving toward Florida, land-based radar did not detect it, as of Thursday night.

How do we have images of Irma where Doppler radar doesn’t reach, then?
PRECIPITATION MEASUREMENT FROM AFAR
Global Precipitation Measurement – GPM
NASA provides us some pretty amazing images of tropical storms and hurricanes well before we can detect them from land-based instruments. Not only can we see the cloud structures, but we can estimate the amount of precipitation and understand the internal structure of these behemoth storms.
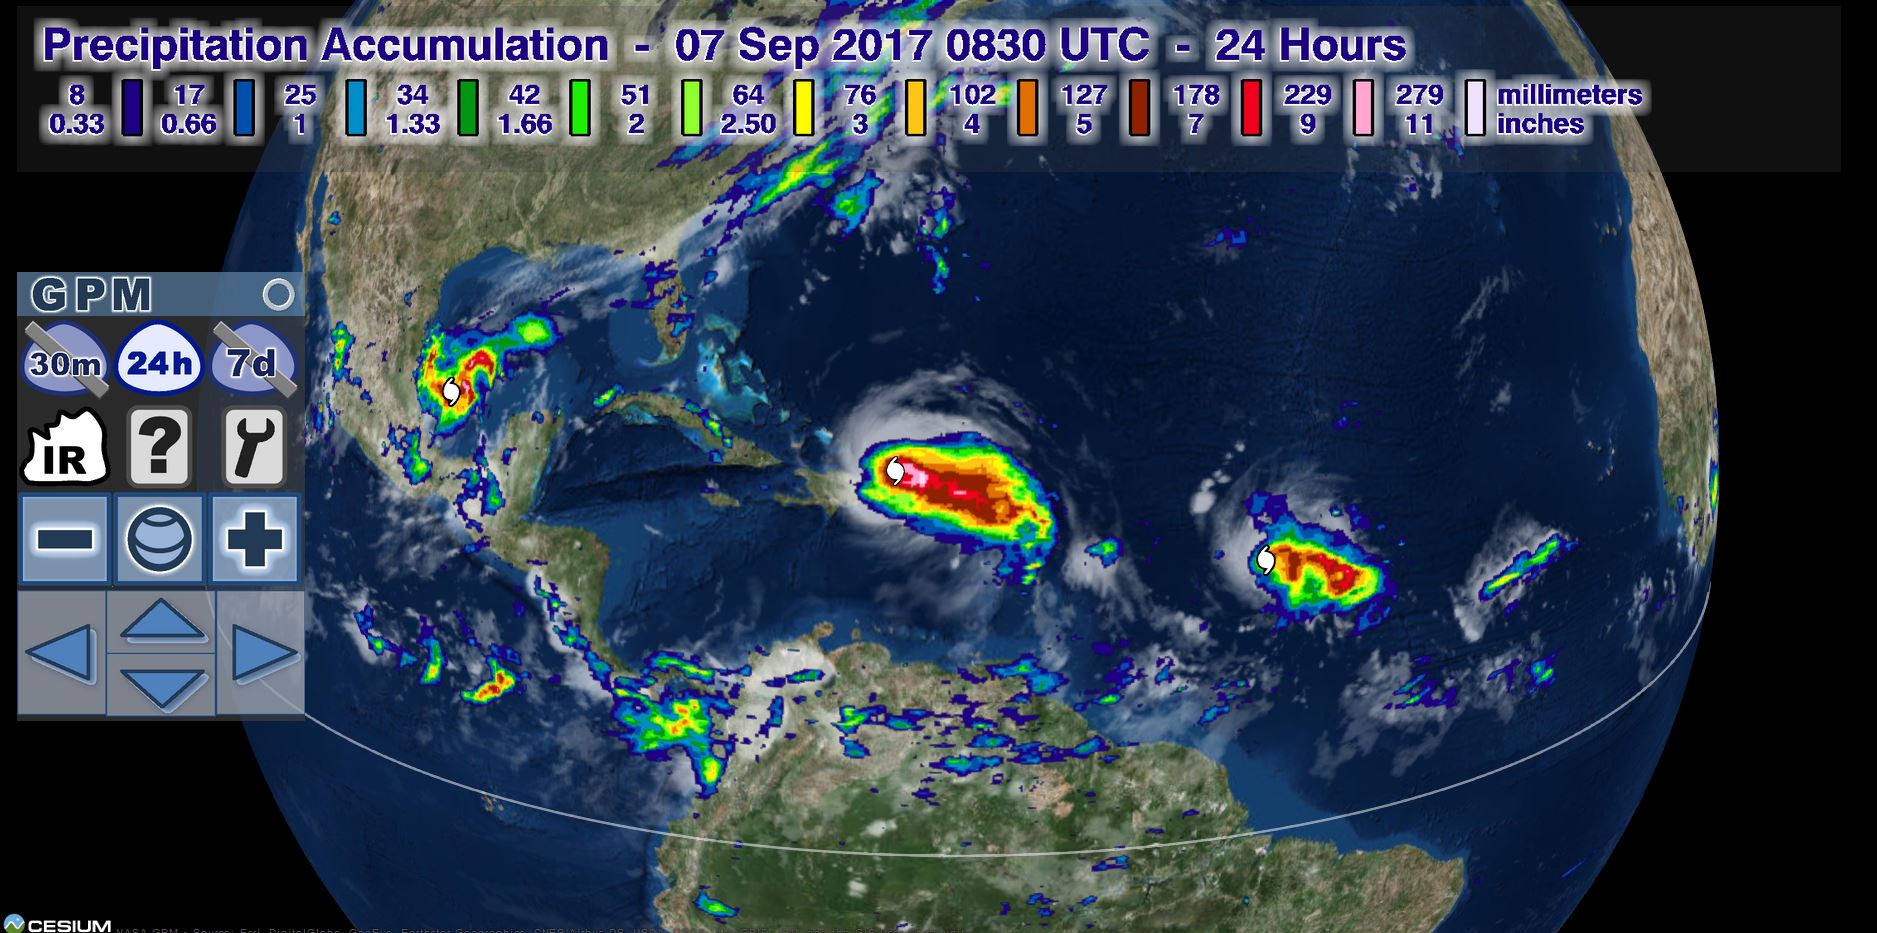
In this case, remote sensing techniques, using an array of satellites to emit and receive signals that are bounced through the storm.
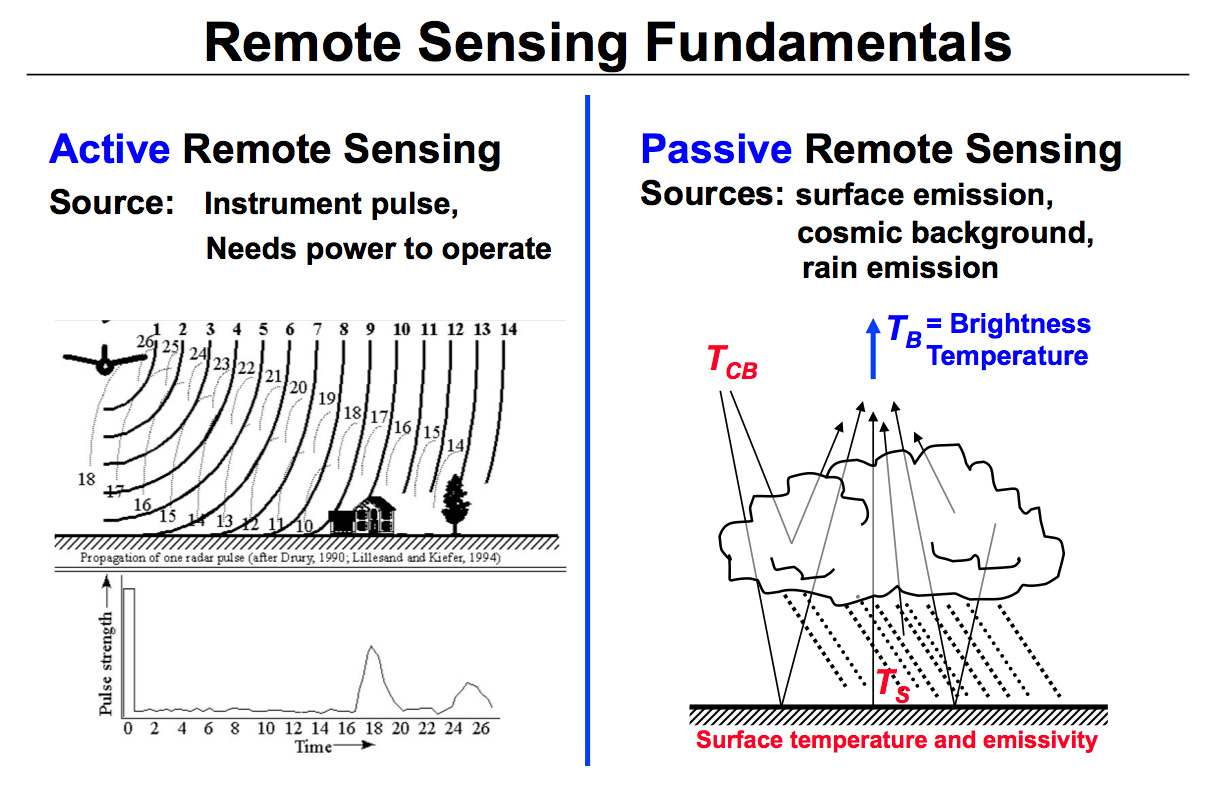
NASA’s Global Precipitation Measurement (GPM) mission uses both active and passive methods to coordinate measurements of precipitation throughout the world.

The coordination of the GPM Core Observatory (NASA and the Japan Aerospace Exploration Agency, JAXA) with multiple other satellites globally also makes it possible to develop three-dimensional models for hurricanes.

So we can see them, but how do we know where they’re going?
FORECASTING HURRICANE TRACKS
Predicting where storms will go is tricky business. All we have to do is watch the local news regularly to know how difficult this is to do. It’s just as tricky with hurricanes, but generally there’s more at stake, so meteorologists strive to make the best predictions possible.

There are multiple ways in which to predict the path of hurricanes. Predictions, like the five-day outlook above, are based on the consensus of multiple predictions.
Hurricane predictions fall into five categories:
- Dynamical – Completely computerized models that include sea surface temperatures, wind directions, etc. Like climate models, dynamical models estimate the atmosphere, the ocean, and the land in order to predict the direction and strength of hurricanes.
- Statistical – Based upon historical development of similar hurricanes. If there was another hurricane that was on the same path, but 20 years ago, statistical models assume the current hurricane will behave the same way.
- Statistical-dynamical – A combination of both statistical and dynamical models. In this case past measurements of air temperatures, wind directions and strength, ocean temperatures will be included to make a better estimation of the hurricane direction.
- Trajectory – Using only wind directions and strengths plus the current direction and rate of travel of the hurricane, its movement will be predicted.
- Ensemble – Methods that combine all of the above to make a prediction for the track fo the hurricane.
The various models used are listed and described on the National Hurricane Center’s website, here.
None of these models are perfect, because there are always assumptions that must be made and unknown variables. But together, where all the models agree, there’s a very good chance that the prediction is correct.
Now all we can do is watch and wait. Where will Irma actually strike? How strong will she be? Let’s see if the predictions are correct.
