You see them in everywhere in papers and posts related to paleontology.

Alexei Kouprianov CC BY-SA 3.0
Cladograms. Little tree-like drawings that show the relationships among different organisms. A cladogram is a hypothesis about the evolutionary relationships among different organisms (A, B, and C in the cladogram above). Another term for evolutionary relationship is phylogeny.
The process of making a cladogram is called phylogenetic systematics, or more commonly just cladistics.
What is cladistics, and why do we use it over other methods to determine relationships?
Before cladistics, the way we understood evolutionary relationships was by simply observing the organisms and guessing how relationships might have worked by similarities we see.

The relationships were thought to be like a tree, with individual organisms branching off of the trunk at different levels. This method is dependent upon the opinion of the observer, and is difficult to prove or disprove.
Cladistic analysis provides a mathematics-based means of developing hypotheses about the evolutionary relationships. By using math, it becomes possible to apply statistical analysis to support the likeliness of a cladogram being true. Scientists can list the observations that they made to develop the tree (characters and character states) which allows other scientists to know what the basis is for making the hypothesis. Now scientists can argue to pros and cons of hypothesized relationships (And they do. Oh boy do they argue!).
When a person is preparing to do a cladistic analysis, the first step is to define characters and character states to describe the organisms studied. A character might by ‘eye color,’ and the states, ‘blue’ and ‘brown.’ Ideally, all the characters have only two states, and one clearly evolved from the other. For example, the character could be ‘Lungs’ and the states could be ‘absent’ or ‘present.’ Organisms that have lungs evolved from those that do not.
As the tree is built, every time a character must change its state is called a step. For the most part, one would hope that each character only changes state one time on a tree, but sometimes it changes more than once. Each time is another step. When the tree is finished, we count up the steps and call that the tree length.
Using a principle called parsimony, it is assumed that the simplest tree – the one with the fewest steps – probably best represents what really happened. It is most likely to be ‘correct.’ This makes sense so that evolution doesn’t have to keep going back and forth between character states.
The problem is that we often get more than one shortest or most parsimonious trees. This happens because we may or may not have selected good characters or character states, or that we’re basing our relationships on characters that actually don’t matter. Because our choices of characters and states are laid out, this gives scientists the opportunity to discuss the potential relationships.
But what do we do with all these trees? We can summarize them by either showing which groupings and branches always appear in the most parsimonious trees (strict consensus) or that show up in some specified portion of the trees (majority rule).
This brings us back to the original topic of this post, the clade.
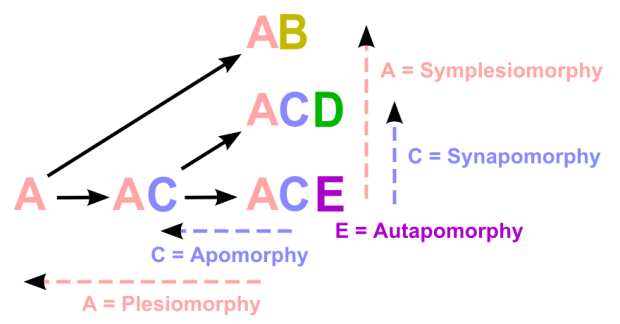
Clades are groups of organisms shown to be related to each other by sharing the more evolved state of the character, termed a synapomorphy. In the case of the previous example, all organisms having lungs are in a clade together.
You can also group things by sharing the primitive character (symplesiomorphy), for example grouping all the organisms that lack lungs. But, because organisms that have lungs evolved from organisms that lacked lungs, the group of organisms that lack lungs are not a clade. Instead, they are called a grade.
Cladistic analysis depends completely on synapomorphies, shared derived character states.
Faustino Núñez Hernández CC BY 3.0
Clades include all the organisms that share a common ancestor. On a cladogram, a clade is all the organisms that are connected to each other by a specific branch point.

Life of Riley Public Domian
All the organisms in a group are closely related to each other, and nothing is omitted. Such a group, a clade, is called monophyletic.
If any branch or organism is omitted from what could be a clade, then the group isn’t a clade at all. This is called paraphyletic. An example of this is the dinosaurs. Unless modern birds are included with dinosaurs, then dinosaurs are paraphyletic. When birds and dinosaurs are grouped together, the group is a monophyletic clade.
There is a third kind of grouping called polyphyletic. These are organisms that are grouped together but really aren’t closely related. Arthropods are such a group. They are grouped because they have an exoskeleton of chitin, but aren’t otherwise very similar to each other. The chitin exoskeleton is a primitive characteristic. Thus, arthropods form a polyphyletic grade.
What I haven’t done here is discuss the mechanics of making a tree, of how to know what the which character states came first, or other types of mathematical phylogenetic analysis. My hope is that from this you can at least understand what you’re looking at when you see a cladogram in a paper or somewhere online.
We use cladistics to help us understand evolution. Some relationships always come out, and others… not so much. It’s an important tool for paleontologists and biologists, and it is necessary for anyone studying in those fields to understand the general principles of cladistics.
