
Sometimes, I write these posts to explain something that I myself am trying to understand. So here goes.
Color. You know, the spectrum. Red Orange Yellow Green Blue Indigo Violet. ROY G BIV.

For the majority of us, seeing color is no biggie. We see rainbows and whatnot. We recognize a cherry-red hotrod. But, sometimes we argue over color as well. Is teal a form of blue or of green? Or what about those of us who are color blind? Or totally blind for that matter? We need ways to describe color that work whether we perceive color the same way or not.
If you’ve done much work at all on a computer, you’ve undoubtedly seen things like RGB or CMYK. These are two ways to describe colors, either starting with three main colors (RGB: Red, green, and blue) of four main colors (CMYK: Cyan, Magenta, Yellow, and ‘key’ (black)). All colors can be made on a computer screen by combinations of these three or four starting colors. This works great for computers, but it is somewhat dependent upon the monitor or printer and inks that are being used.
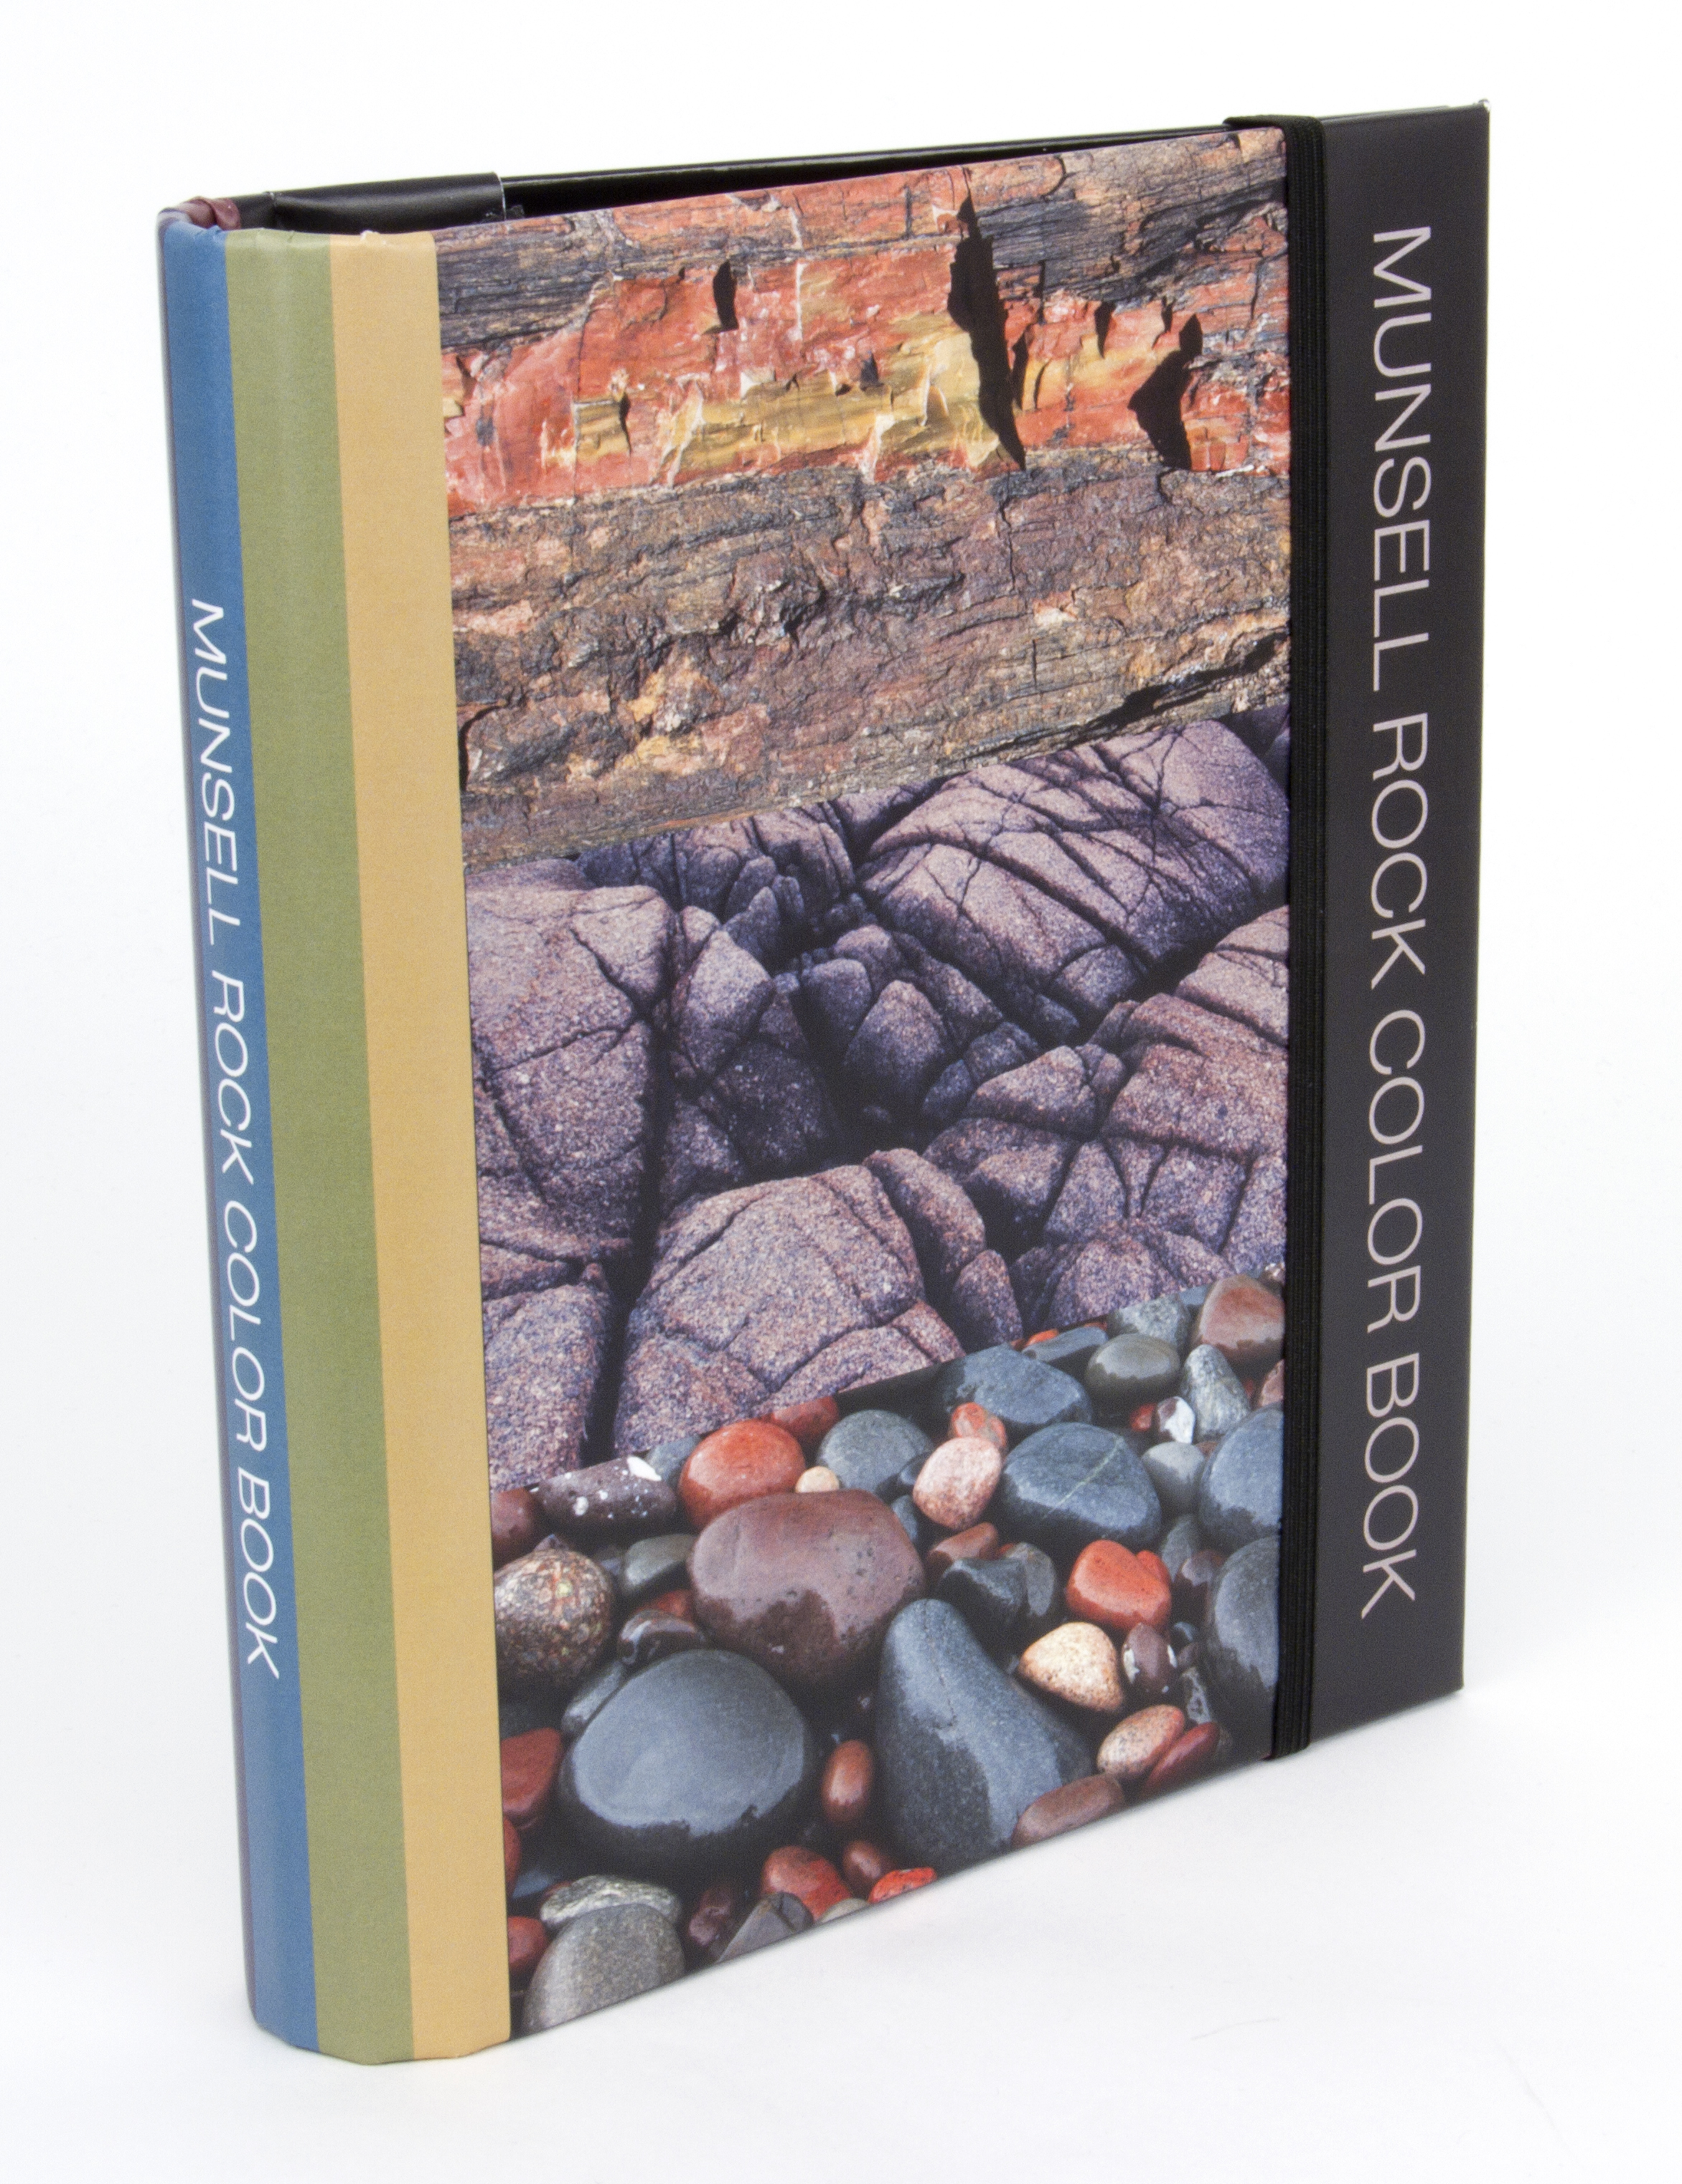
In geology, sometimes we discuss rock color. For example, one might say that the vertebrate fossil bearing rocks in the Hanna Basin tend to have a greenish cast to them. Or that altered rocks are bleached, and unaltered rocks are yellowish. We want to quantify this a little bit better. There are rock color charts that you can use to assign a specific code to the rock. You hold a painted, coded color chip next to the rock and see if they’re similar. There are several to choose from.
But even this is prone to some subjectivity. A difference in lighting (sunny versus cloudy) can change the look of a rock.
To do color analysis right, one must control the light striking the rock (or whatever) and quantify the various color parameters. These parameters could be RGB or CMYK, but when doing color analysis two different methods (each related to the other) are used. For this, the International Commission on Illumination (CIE) in 1931 devised color spaces, some are similar to RGB and others have different components. In all cases there are three coordinates that are defined.
One of these is the CIE 1976 (L*, a*, b*) color space (commonly called CIELAB). In this case, the value of L* defines the lightness of the color. A continuum between green (negative a* values) and red (positive a* values) is the a* axis. A continuum between blue (-b*) and yellow (+b*) defines the b* axis. Any color can be described with these three parameters, similar to a plot with X, Y, and Z scales.
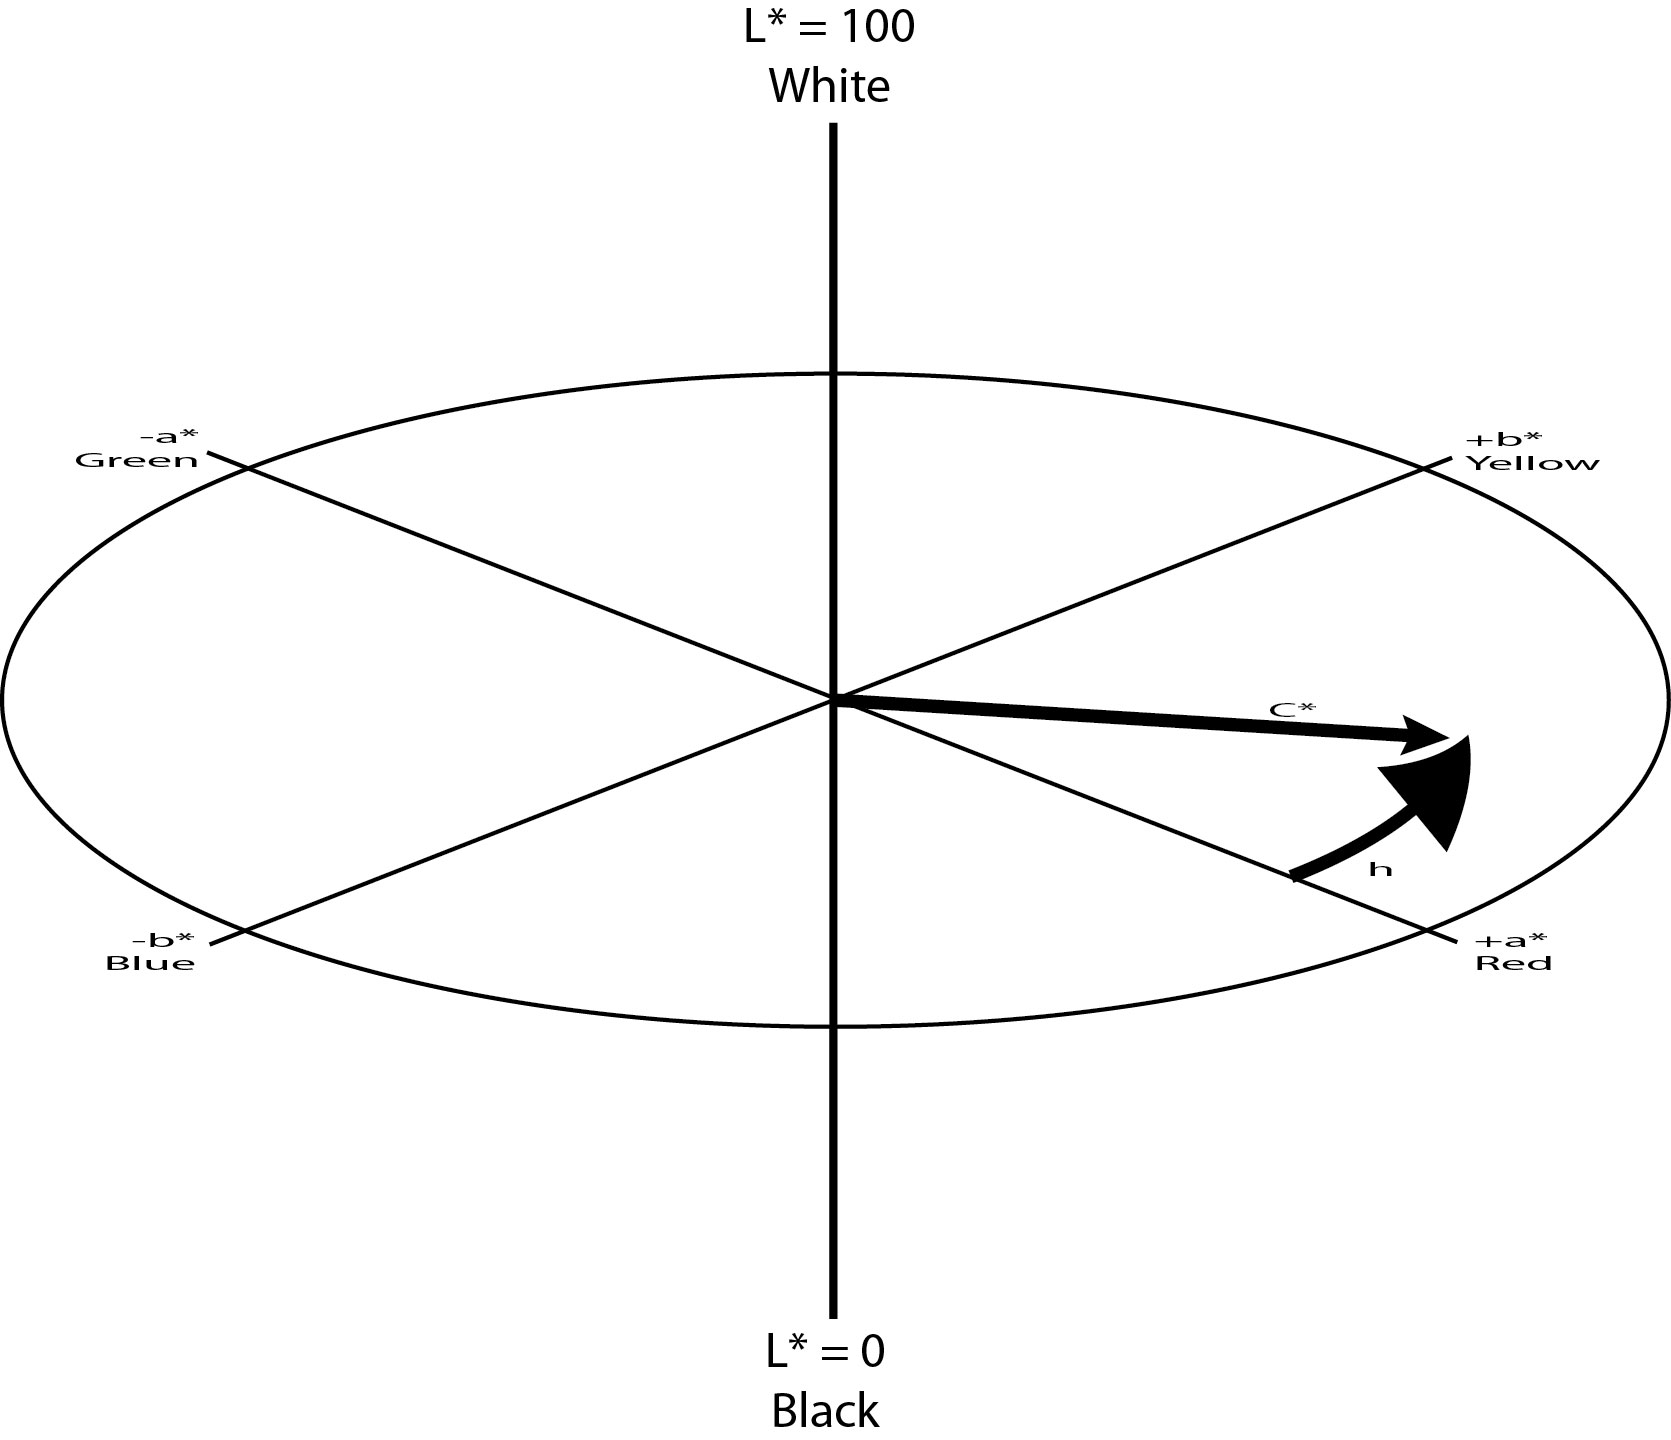
From this can be derived the CIELCH color space, it uses angles and vectors. It still uses L* for lightness. It has two new parameters, C* and h. C* is for chroma, which is the distance from the center of the plot (where a* and b* would be zero). The angle measured counterclockwise from the +a* axis is the hue, or h.
These parameters are most quantifiable when the light source is also of a specific wavelength. Rocks do look different during a red sunset versus the highpoint of the day. Thus proper color analyzers have standard ‘illuminants’ that are specified whenever analyses are made.
This summer, I had a chance to try out a swanky new color analyzer called the RM200QC from X-Rite in the field.
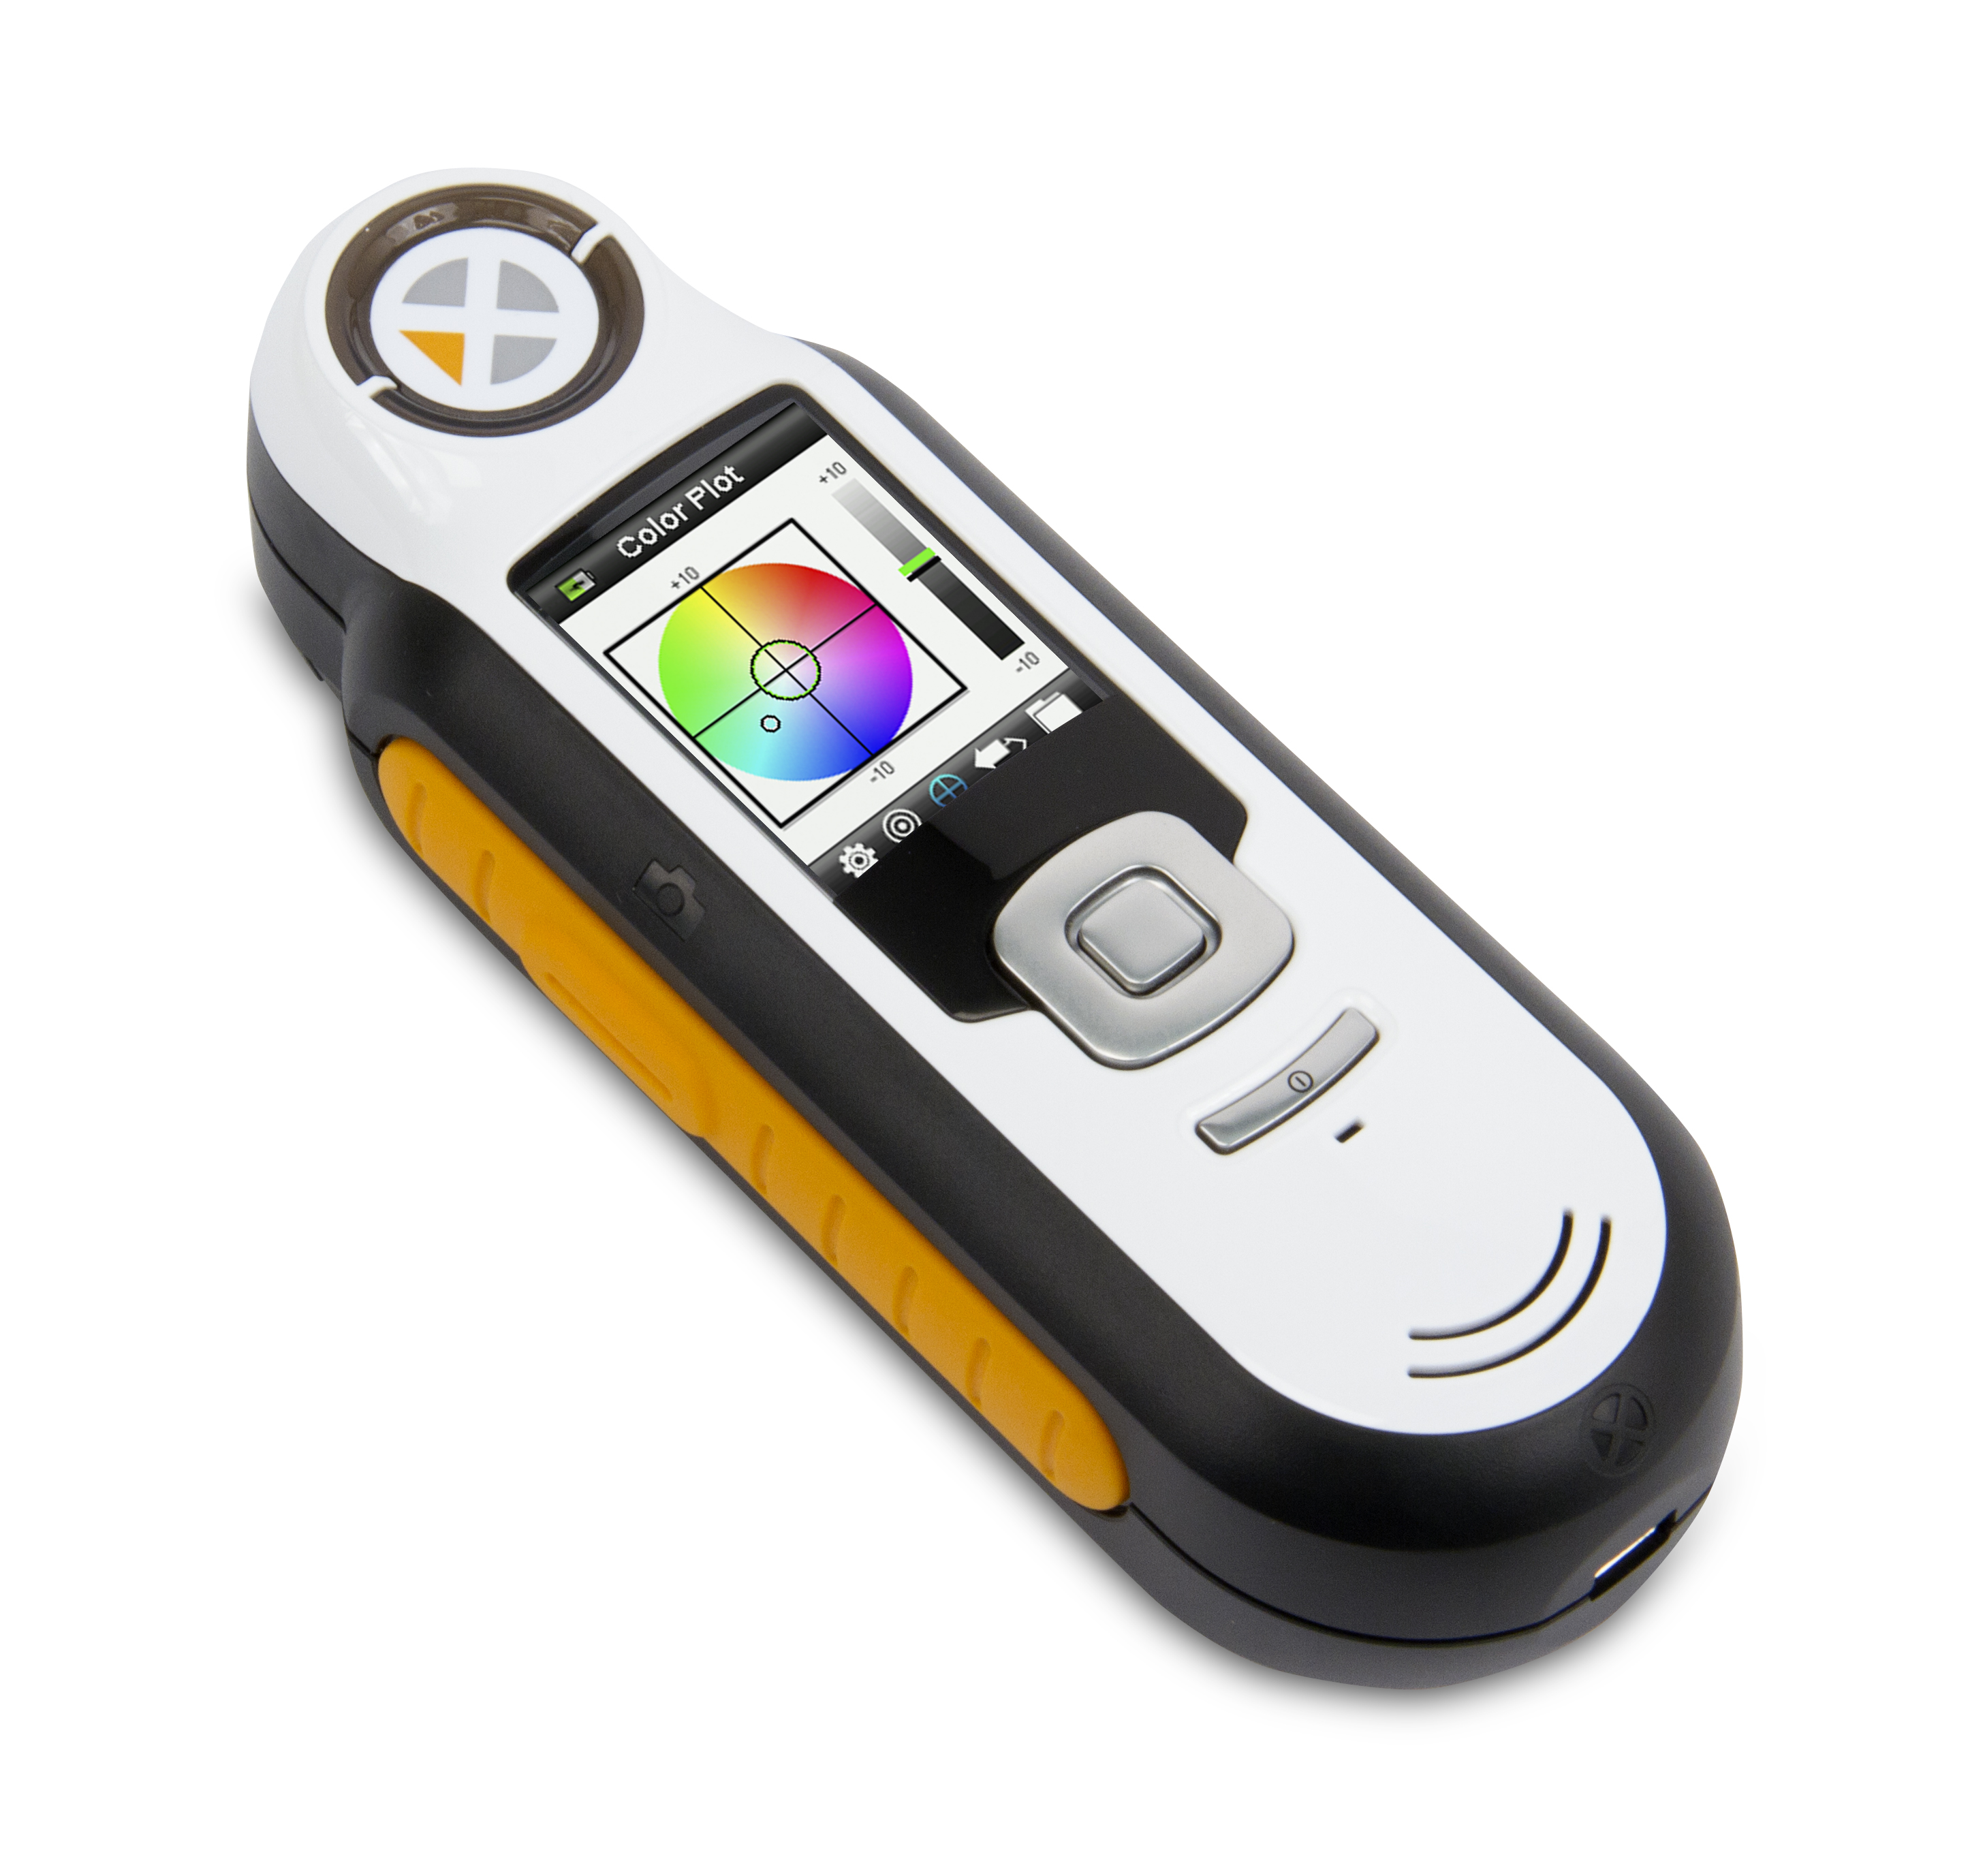
This instrument is a spectrocolorimeter (which combines the capabilities of a colorimeter which focus only on mixtures of red, green, and blue, and a spectrophotometer which takes into account the texture of the surface that’s being measured for color).
My objectives were simple. I wanted to see if color could help sort out some issues in the rocks that I was looking at. In some areas, changes in rock color have helped scientists discern 20,000 year cycles that were going on over 50 million years ago. (Alas, paywalled). I wanted to know if I could apply this in the Hanna Basin to my own Paleocene-Eocene section. Researchers have also qualitatively used color to distinguish between two rock units (the Uinta Formation and the Duchesne River Formation) in the Uinta Basin. Since I was there, it seemed like an obvious thing to try to quantitatively look at color between the two formations.
Now that I ‘get’ what all the numbers I have are actually measuring, I can take a look at the real data. Maybe, I’ll post some preliminary results here, too. You all can help me make sense of it, right?
